The data already exists
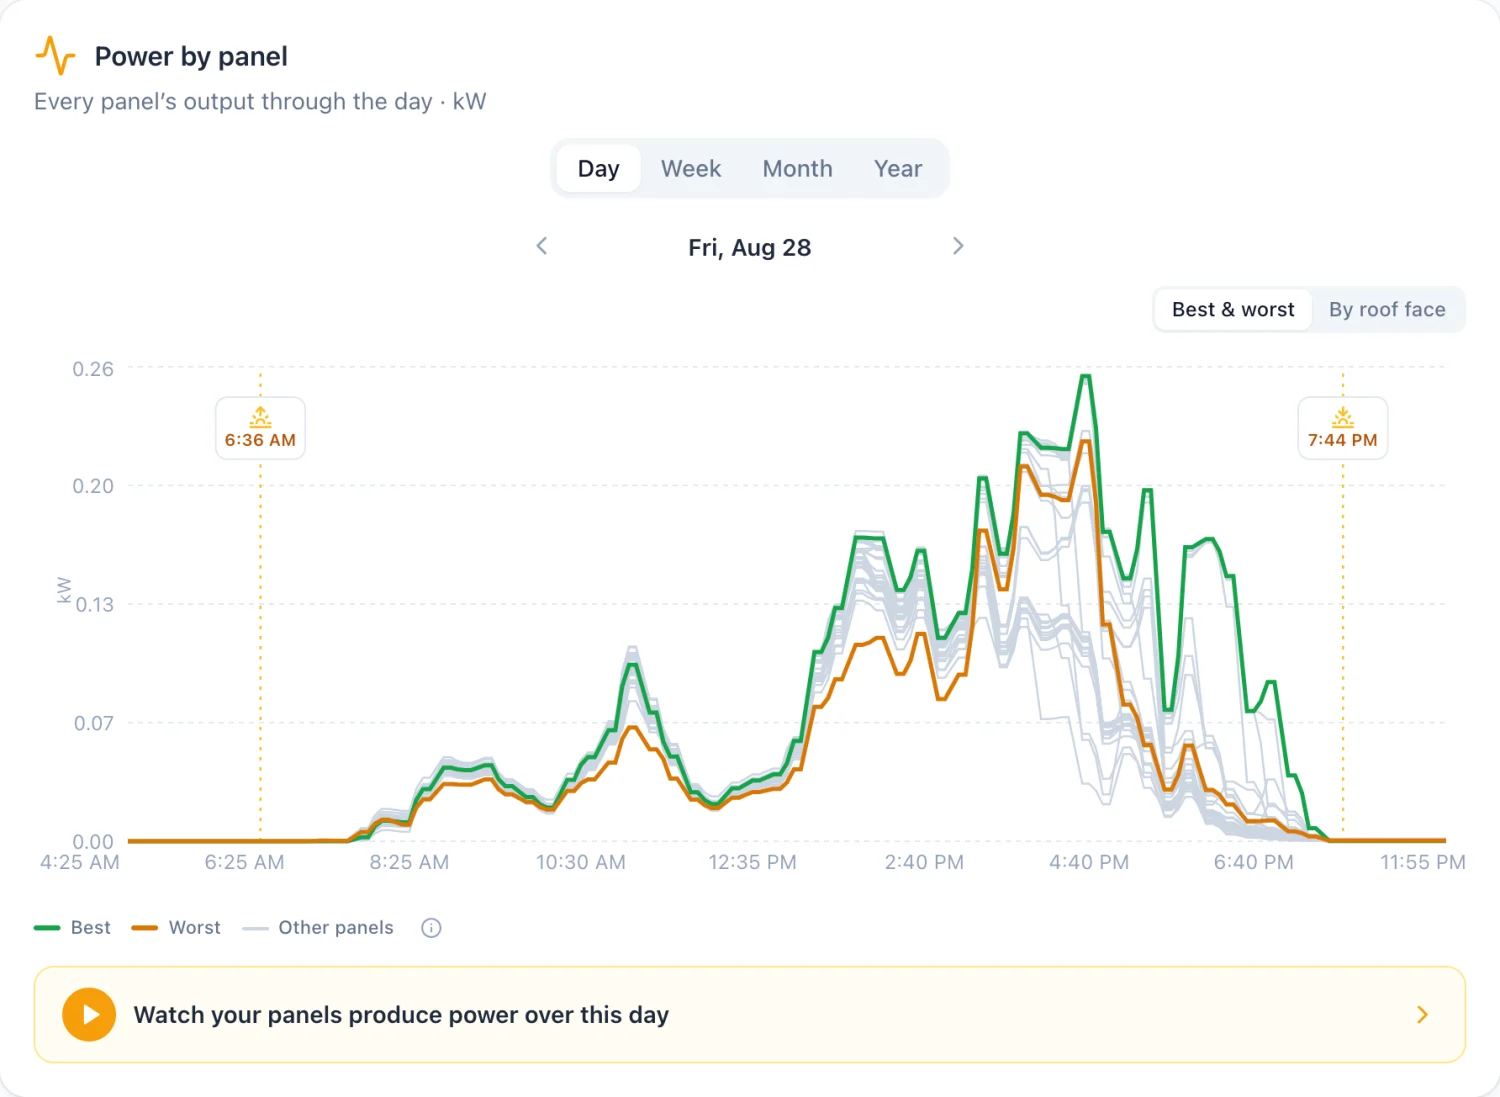
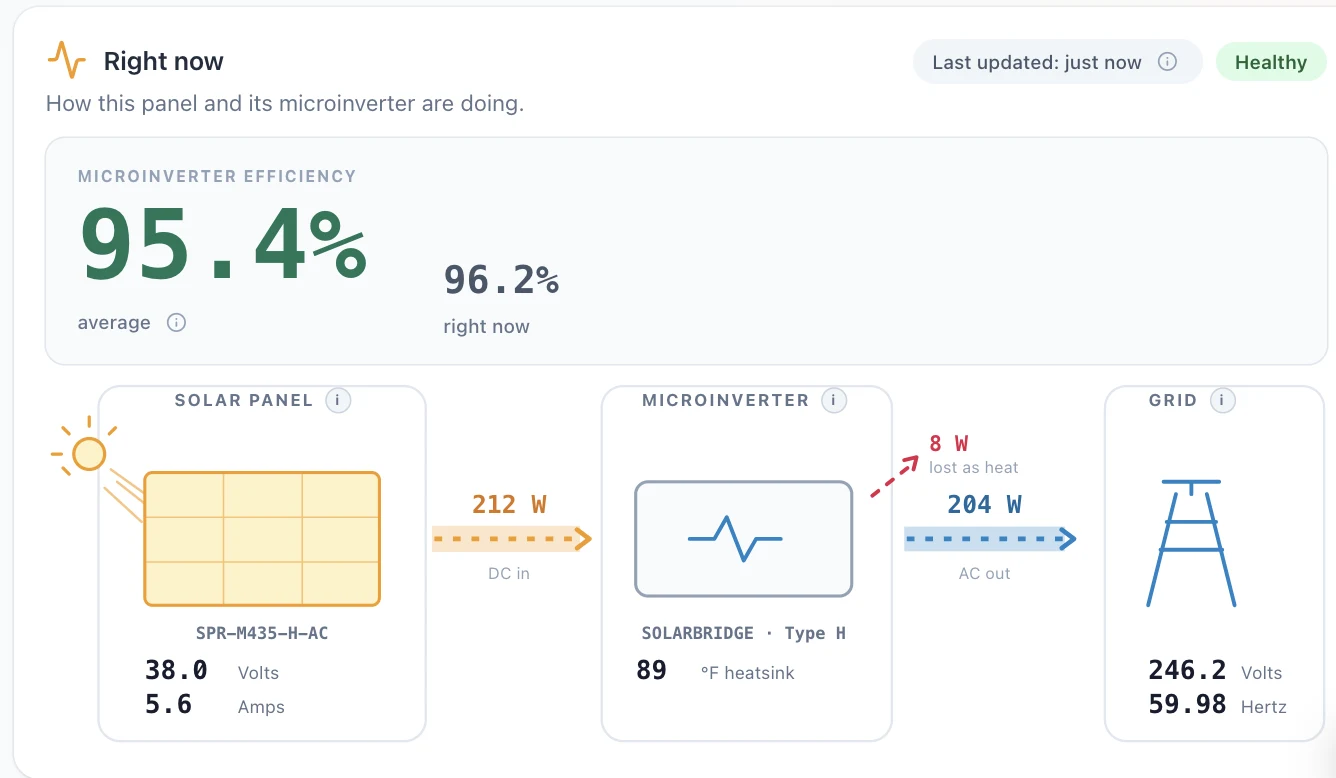
SunPower systems are microinverter-based, which means every panel reports on itself individually. That per-panel telemetry travels to your PVS6 gateway and is available on its local interface — which exposes more than the official app ever chose to display:
- per-panel power output, tracked separately for each module;
- per-panel temperature, voltage, and frequency;
- meter-level production and consumption;
- battery state of charge, where a battery is fitted.
One honest caveat on consumption: whole-home consumption only works if CT clamps were fitted at installation. Many installs omitted them, and post-bankruptcy that's a difficult gap to close. Production and per-panel data are unaffected — they don't depend on the clamps.
Why this is the number that matters
Array totals hide single-panel faults, and the arithmetic is unforgiving. In a thirty-panel array, one dead microinverter costs about 3% of production. That won't show up on a utility bill against seasonal and weather variation, and it won't show up at the meter. It just quietly runs for years.
Per-panel data turns that from an invisible loss into a specific fault: that panel, that date, that much lost. Which is also exactly what you need if you're going to make a warranty claim.
How to actually see it
SunStrong Premium
The official route. Panel-level monitoring sits in the Premium tier at $9.99/mo or $99.99/yr, alongside history and analytics — and SunStrong notes it's available for micro-inverter systems only. The free Basic tier does not include it. Lease and PPA customers get Premium bundled with their lease.
Pay Enphase to replace the gateway
A technician swaps the SunPower gateway for an Enphase one, which gives you per-panel data on Enphase's platform. The most hands-off route, and the most expensive — hardware plus a service call, with an appointment to be home for. $999 as of August 2026; confirm with Enphase. Not available for SunVault battery systems, which Enphase's monitoring-restoration service explicitly excludes.
Plug a monitor into the gateway you already own
The WattHacker monitor reads the same local per-panel data and shows it without a subscription: per-panel data is free, forever, not behind a paywall. The optional premium plan adds the history you need to spot a panel fading rather than failing outright, and alerts you in dollars when one drops. No technician — you plug it in yourself.
Technical alternative worth knowing: the local interface is well documented and free open-source projects read it directly, if you're willing to run and maintain one.
A warning about replacing a failed microinverter
If per-panel data does turn up a dead unit, don't order a generic replacement. SunPower Type E / IQ7X microinverters need voltage-matched replacements — standard Enphase IQ7+ or IQ8+ units are destroyed by the high-voltage X-Series panels they'd be fitted to.
Replacement also requires a Q-Field-Wireable connector, which alters the UL assembly and triggers NEC wet-location compliance, plus an authorized installer to add the new part to the reporting platform. This is a real trap and it has caught people. Diagnose freely; buy parts carefully.
Where WattHacker fits
The WattHacker monitor is a small box that plugs into your existing SunPower PVS6 gateway on your own home network and reads it directly. It doesn't rely on SunPower's or SunStrong's servers, because for owners like you those are either gone or behind a paywall. No technician, no electrician, no rewiring — you plug it in yourself.
- The monitor is $50 once, with a 30-day money-back guarantee.
- Free to see your panel data, forever — every panel, live, no subscription, and no card on file.
- An optional premium plan at $6/mo (billed annually) adds the memory: full history kept for good, year-over-year comparison, and alerts told to you in dollars.
- Built by an electrification superfan who wants to help others use their solar smarter, lower their utility bills, and clean up the planet. Who's behind it.
Still have questions about your own system? I'll go through it with you — your panels, your bill, and what's worth doing about it.
Book an energy reviewOwn a SunPower PVS6? See it for SunPower.
Real panels, real production.
Common questions
Can I get per-panel data from a SunPower system?
Yes. SunPower systems use Enphase-based microinverters, so each panel reports individually to the PVS gateway. The gateway's local interface exposes per-panel output, temperature and voltage — more detail than the official app ever displayed.
Why does the free app tier not show individual panels?
SunStrong's rebuilt app puts panel-level monitoring, historical data, and analytics in its Premium tier at roughly $9.99 a month. The free Basic tier covers real-time power flow and system health only.
Why does per-panel data matter?
A single failed microinverter in a thirty-panel array costs roughly 3% of production. That is invisible on a utility bill and invisible at the meter, so it can run for years unnoticed. Per-panel data is the only way to catch it.
Do you support the PVS5, or only the PVS6?
The monitor reads your gateway's local interface, and the PVS5 exposes the same one — so it was built to work with both. What we can't tell you yet is that it's confirmed, because we haven't had a PVS5 to test on. That testing is open now: if you have a PVS5 and want in, email tony@watthacker.com and you can be one of the units we verify it against.
See your own panels, live.
See plans Try the demo Back to home