Shade has three shapes, and only one of them is the obvious one
Most people picture shade as a dip in the middle of the day. That is the least common version.
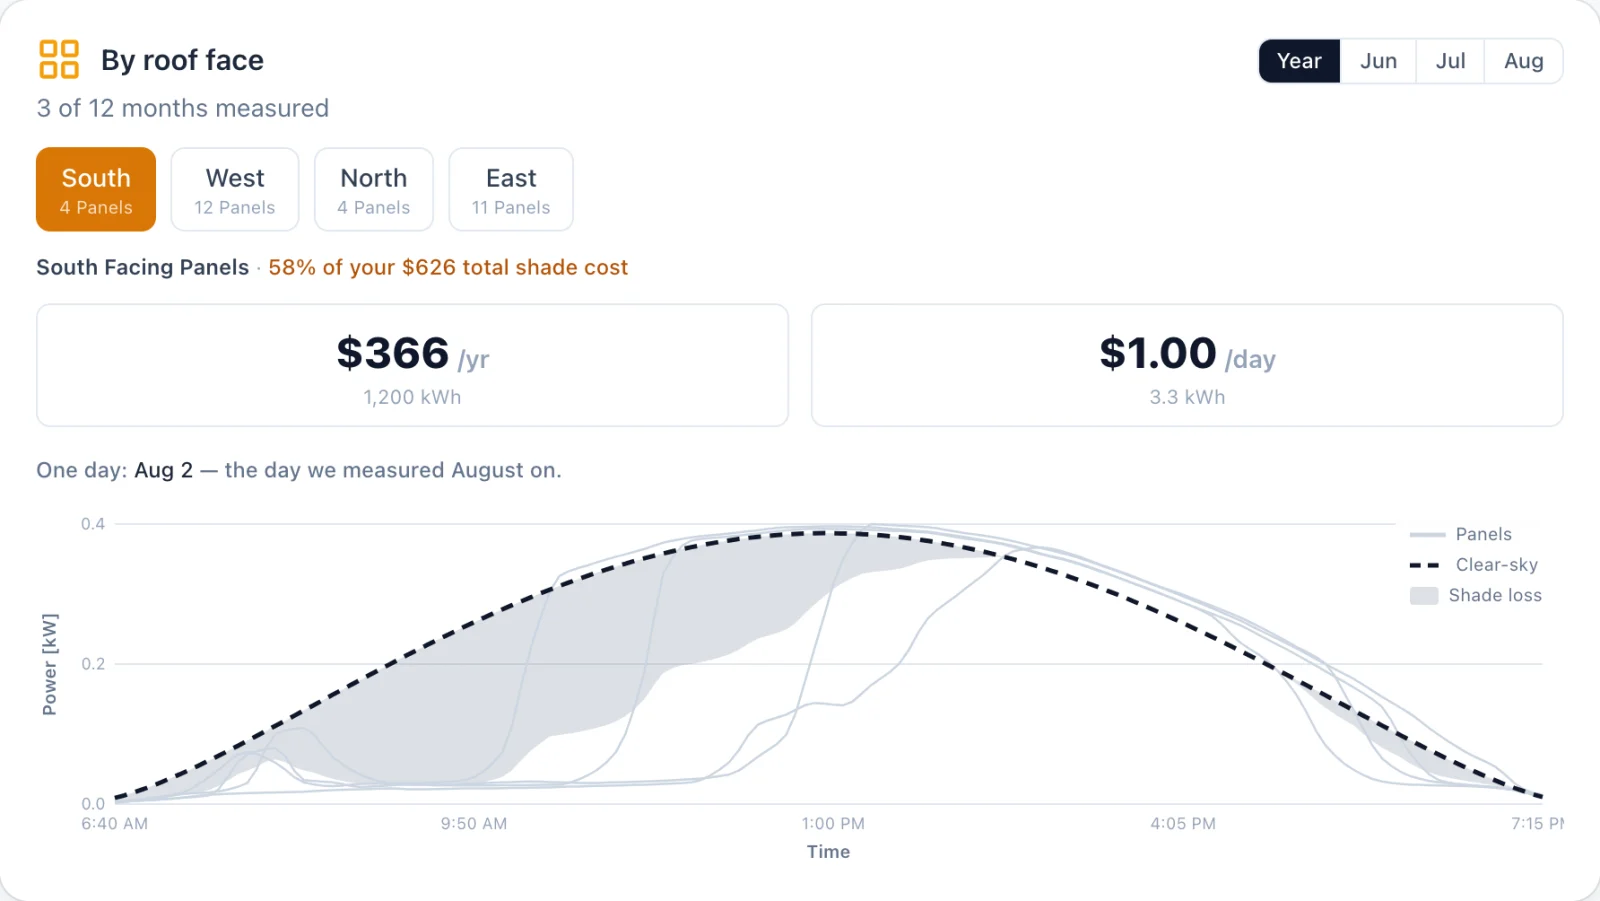
On real roofs, shade usually lives at the edges of the day. The sun is low, so anything to the east or west casts a long shadow across the array.
- Starts late. The panel produces nothing for the first hours of daylight, then comes up and joins its neighbors for the rest of the day. Something to the east: a tree, a neighbor's roofline, a hill.
- Stops early. The panel tracks its neighbors all day, then drops to nothing well before sunset and stays there. Something to the west.
- A bite out of the middle. Less common, and usually something small and close, like a chimney, a vent pipe, or a mast, crossing the panel as the sun passes it.
Diagrams of the three shapes, not measurements. They are drawn the way the app draws your real ones, so you recognize yours when you see them.
In all three the output goes to the floor, or close to it, not to a gentle sag. Shade comes in and leaves: the panel is either in it or out of it.
That sharpness is what makes shade recognizable once you have seen it once.
Shade or cloud? Look at the neighbors
A passing cloud can carve a notch into a panel's day that looks a lot like shade. To tell them apart, don't look at the panel. Look at the panels around it.
- Every panel dips together: cloud. A cloud, a rainy day, or a gray sky dims the whole system at once. Every panel on every roof face drops at the same moment and comes back together.
- Only some panels dip: shade. The neighbors carry on as normal, and the dip belongs to the panels something is blocking.
- One whole roof face dips: still shade. A building or a large tree can shade an entire face. If every panel on one face starts late or stops early at the same time day after day, while the other faces carry on, that is shade, not cloud. Single panels are more common, but a whole face is not unusual.
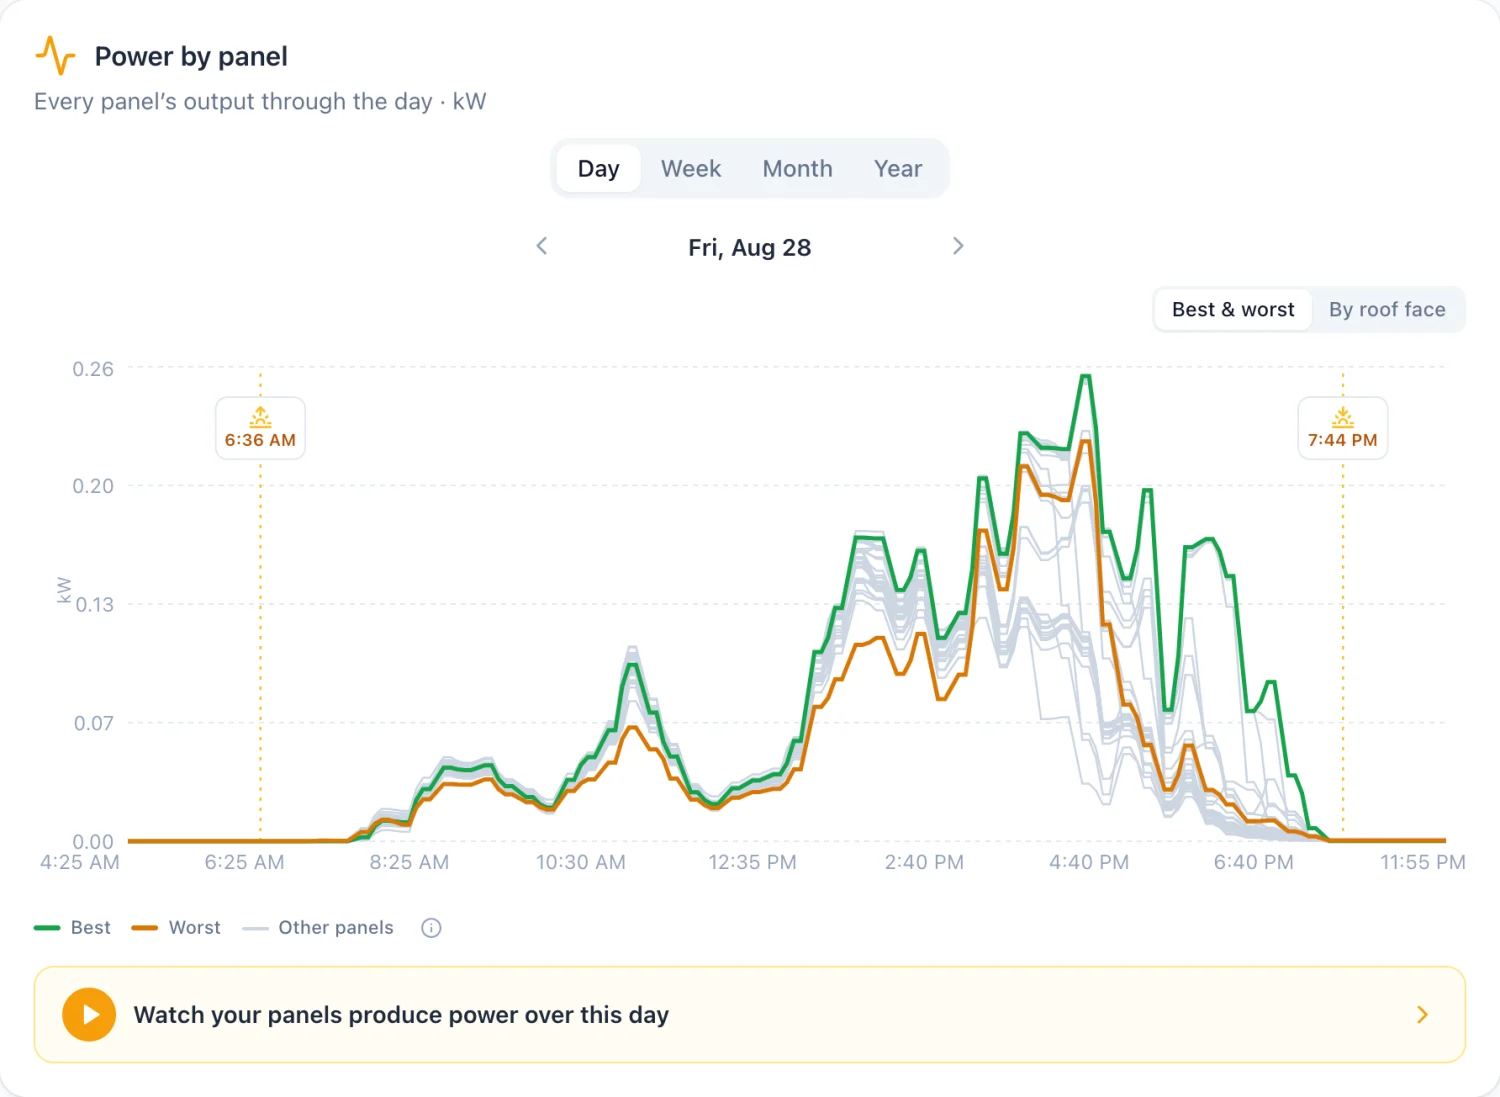
Diagrams, not measurements. In a WattHacker account, a panel's day chart draws it against the other panels on the same roof face, so you can make this comparison on your own roof, on any day.
How to tell shade from a panel that is failing
This is the question worth answering. The two cost you the same power and have completely different fixes.
From a monthly or weekly total they look the same: both just read "low". From the shape of a single clear day, they are obvious.
- Shade has edges. Output falls off a cliff and comes back up one, at the same time each day. Nothing else on the roof does that.
- Dirt has no edges. A soiled panel keeps its normal shape and its normal hours. The whole curve just sits lower, evenly, every day until it is washed.
- A failing panel looks unlike its neighbors. Not lower in proportion, but a different shape: dead all day, or cutting in and out at random, while the panels either side of it on the same roof face behave exactly as they should. That mismatch is the signature, not the height of the curve.
- Shade has a clock. It happens at the same time tomorrow, and the time drifts slowly through the year as the sun's path changes. A fault is there all day, every day, and does not move with the seasons.
- Shade lets go. Before and after the shadow, the panel matches its neighbors exactly. A failing panel never matches them.
Dirt looks like this: the same shape, lower. It is not what a failing panel looks like, and it is nothing like the three shapes above. Wash it first; that is the cheap half of the answer.
One more check, if you have per-panel data: compare the panel with the others on the same roof face, not with the array average.
A north-facing panel is meant to produce less than a south-facing one. That is geometry, not a fault, and comparing across faces manufactures problems that are not there.
A caution worth stating plainly: production data can tell you that something is blocking the light. It cannot tell you what.
A branch, a vent, bird mess, and a dirty patch all look identical from the electricity. Only a look at the roof settles that.
What “less than its neighbors” looks like across every roof we watch
Here is why the neighbor comparison is the one to trust.
Take every panel we monitor, on every roof, and divide its week's energy by the median of the other panels on the same roof face.
Weather cancels out, because the neighbors had the same weather. Orientation cancels out, because they face the same way. What is left is the panel.
Four panels on one roof make 11 to 14% of what the panels beside them make, week after week. They match their neighbors perfectly at eight in the morning, then fall away as the sun climbs.
That shape says shade, and the owner is the only one who can say what casts it.
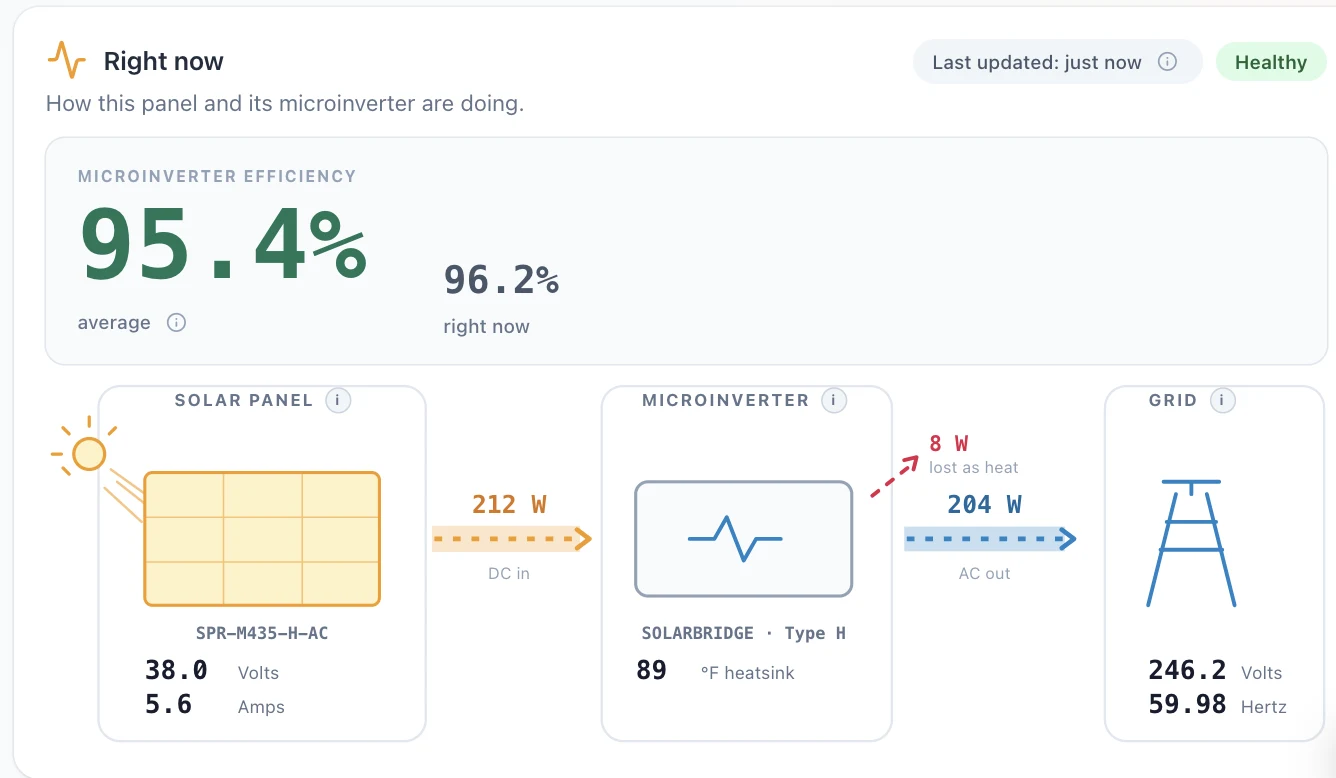
What the data settles: it is not weather, not orientation, and not the microinverter, which converts at a normal 96 to 99% when it has power to convert.
Four different faults, four different signatures
"Producing less" is not one problem. It is at least four, and they need completely different responses.
From a single number on a single day, they are indistinguishable. What separates them is having each panel's DC in and AC out, and something honest to compare them against.
- Dirt. Lands on everything, so the whole roof face shifts down together, roughly in proportion to how dirty it is. The curve keeps its shape and simply sits lower. Rain takes it away.
- Shade. A notch, not a shift. The panel runs normally, drops while something crosses it, then recovers, at the same hours tomorrow, drifting with the season. It falls on particular panels, not the whole face.
- The panel itself failing, on the DC side. A panel's own history hides this one, because a slow decline looks like weather. It shows against its neighbors on the same roof face: same sun, same tilt, same shade, same weather. If this panel's DC is down and theirs is not, the difference is the panel.
- The microinverter, on the AC side. The panel is fine and the conversion is not. DC arrives normally and less AC leaves, so the loss is invisible in production figures. It is obvious in conversion efficiency: this panel converting several points below the others on the same face.
Why this needs a season, not an afternoon
Every one of those comparisons can be faked by the sky for a day. A cloud is a notch like a branch, except it lands on every panel at once. An overcast week is a shift like dirt.
A hazy afternoon drops every panel at once and looks like nothing at all.
The weather gives itself away by being the same for everyone and different tomorrow. That only shows if you keep each panel's production day after day, and compare panels against their own neighbors across many conditions.
Clear days carry most of the answer, because that is when the sky stops being the explanation.
⚠️ That is the honest reason this cannot be a one-off inspection or a photo of your roof. It is not cleverness, it is patience, and it is the part we do, so you do not have to.
Production data can tell you that something is blocking the light. It cannot tell you what.
What shade actually costs
Across the roofs we currently monitor, a single residential panel is expected to produce roughly 600 to 700 kWh a year. That is measured from each roof's own orientation, tilt, and panel rating, not a rule of thumb.
So a panel losing half its output to shade loses about 320 kWh a year. What that is worth depends on one thing: whether you would have used that power or exported it.
- One panel at 50% shade: about $95 a year if it offsets power you would have bought at roughly $0.30 a kWh, or about $16 a year if all of it would have been exported at a NEM 3.0 credit nearer $0.05.
- Ten panels at 50% shade: about 3,200 kWh a year, roughly $950 at the retail end, or about $160 at the export end.
- Over ten years, those ten panels are somewhere between about $1,600 and $9,600, before any rate rises.
Two honest notes on that range. First, shade concentrates in the early morning and late afternoon. In many households that is exactly when someone is home and the power is used rather than exported, so the retail end is often the closer one.
Second, we have deliberately not given you a single confident figure. Your rate plan and your usage pattern decide it, and a vendor quoting one number for every home is guessing at yours.
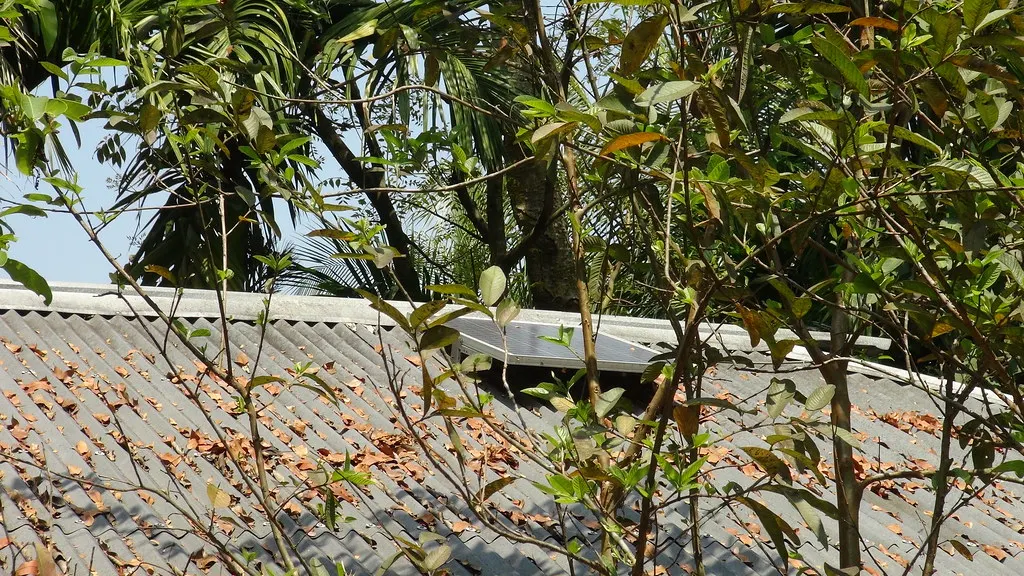
Here is what that looks like added up, on the live demo system: the same view a WattHacker account gives you for your own roof.
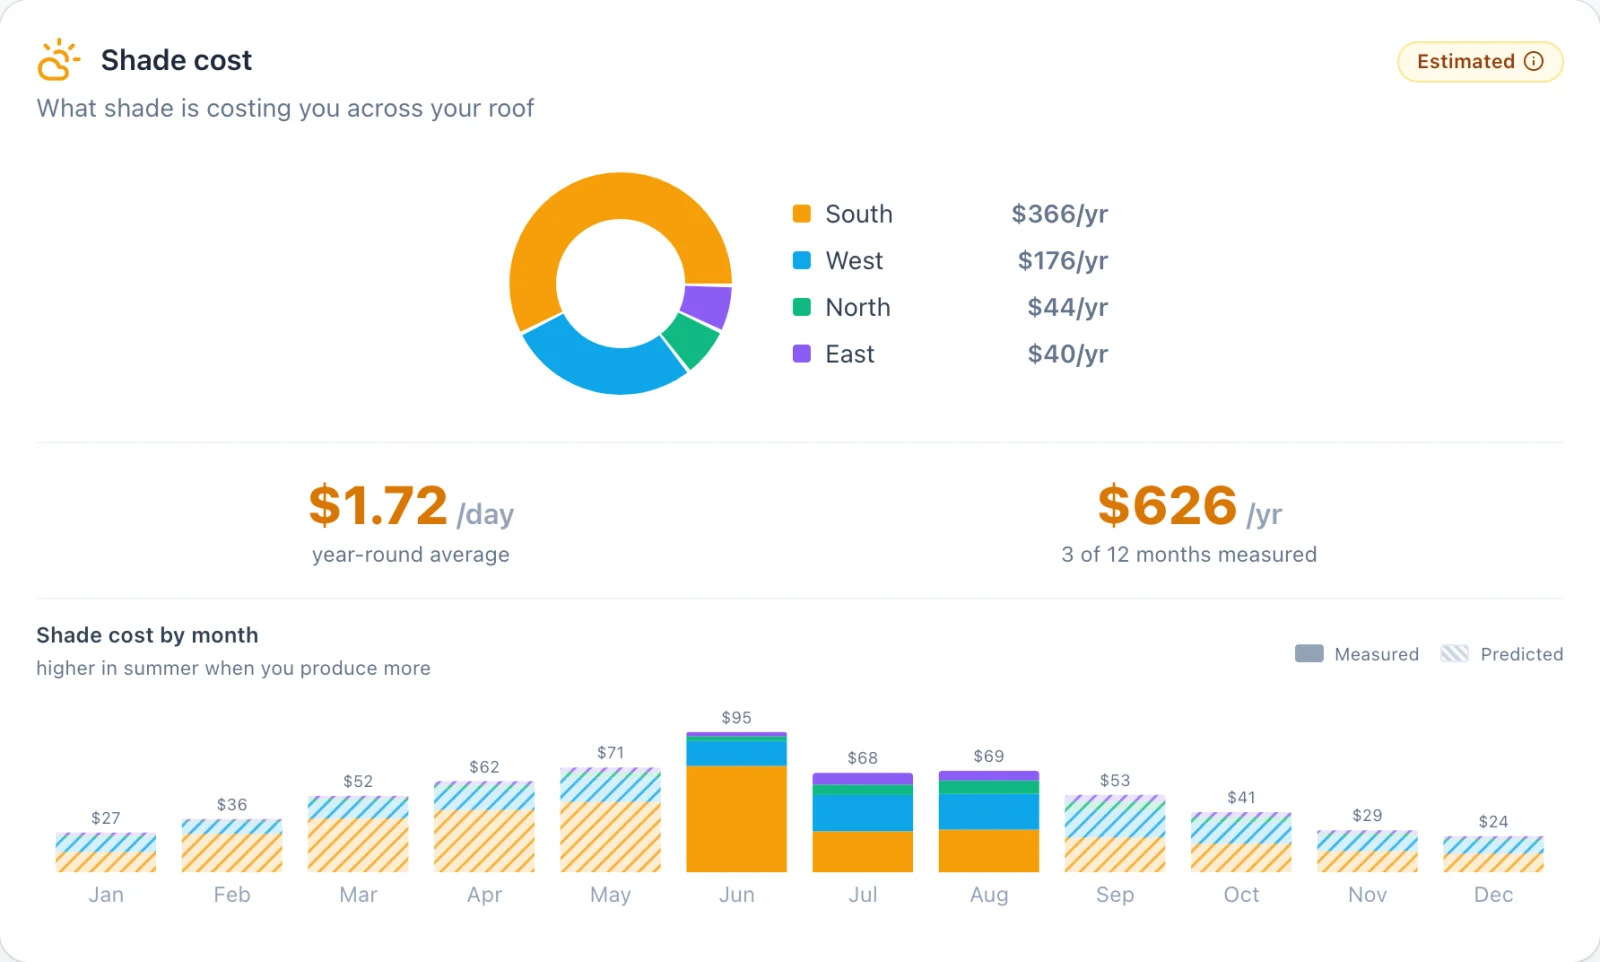
The reason any of this is worth knowing: none of it shows up on your bill. A quarter of your array quietly producing less is invisible against seasonal swings, weather, and a rate change.
It does not fail, it does not alarm, and it does not appear at the meter. It just never arrives.
How common is it, really
We can only tell you what we measure. Across 138 panels on five homes as of August 2026, 40 panels lost more than a tenth of their expected output to shade, 16 lost more than a quarter, and 5 lost more than half.
Five homes is a hint, not a national statistic, and you should treat it as one. What it does suggest is that shaded panels are not exotic: most arrays have a few, and almost nobody knows which.
Shade has edges. Dirt has no edges.
What you can actually do about it
In rough order of how much it costs you to act:
- Find out which panels, and when. This is free and it changes everything else. "The array is a bit down" is not actionable. "These three panels lose most of their morning, and it starts around the same time each day" tells you where to stand and what time to look.
- Go and look at the roof at that time of day. The single highest-value step, and the one people skip. Shade at 8am is invisible at noon. If the data says mornings, go out in the morning.
- Wash the panel. Cheap, and worth ruling out first. Soiling and shade both cut output, and a shadow tends to keep a patch damp and dirty. If a wash changes nothing, you have learned something.
- Trim it only if it is actually yours to trim. Sometimes a branch is a one-afternoon job. Often it is a neighbor's tree, a protected one, or a roofline, and then trimming is not on the table at all. Get the timing from the data first, so you know which case you are in before you start calling arborists.
- Decide, and stop paying attention. If it is a chimney, a dormer, or a neighbor's protected oak, this panel produces less and always will. Knowing that is worth real money in attention you stop spending, and it stops you chasing a fault that was never there.
How to see this on your own system
Your gateway already knows
If you have a SunPower or Enphase microinverter system, every panel already reports on itself.
A PVS6 gateway holds per-panel output on its local interface. Free open-source projects read it directly, if you are willing to run and maintain one.
SunStrong Premium
The official route for SunPower owners. Panel-level monitoring and history sit in the Premium tier at $9.99/mo or $99.99/yr.
The free Basic tier does not include per-panel data, and without per-panel data none of this page is checkable on your own roof.
Plug a monitor into the gateway you already own
The WattHacker monitor reads the same local per-panel data, and per-panel output is free, forever: no subscription, no card on file.
That is enough to do everything above yourself: pick a clear day, look at the panel's shape, compare it with its neighbors.
The shade measurement is part of the premium plan, because it needs history a free account does not keep. Each roof face is sampled on its clearest days, month after month, each panel is compared with its own neighbors, and the loss is added up in kWh.
Being straight about that: the free tier holds 7 days, and a cloudy week can hold no clear day at all. Where a year is not yet complete, we say how many months were actually measured rather than filling in the gaps quietly.
And we say a panel looks like shade, never that we detected it. The shape test is sound; we have not measured how often it is wrong.
So we tell you which part of the day it falls in, show you your own curve, and let you check it. That is the honest version of this feature, and it is the one we ship.
Where WattHacker fits
The WattHacker monitor is a small box that plugs into your existing SunPower PVS5 or PVS6 gateway on your own home network and reads it directly. It doesn't rely on SunPower's or SunStrong's servers, because for owners like you those are either gone or behind a paywall. No technician, no electrician, no rewiring — you plug it in yourself.
- The monitor is $50 once, with a 30-day money-back guarantee.
- Free to see your panel data, forever — every panel, live, no subscription, and no card on file.
- An optional premium plan at $6/mo (billed annually) adds the memory: full history kept for good, year-over-year comparison, and alerts told to you in dollars.
- Built by an electrification superfan who wants to help others use their solar smarter, lower their utility bills, and clean up the planet. Who's behind it.
Still have questions about your own system? I'll go through it with you — your panels, your bill, and what's worth doing about it.
Book an energy reviewAre your panels installed by SunPower or Enphase? See how it works for SunPower or Enphase, or see a demo.
Real panels, real production.
Common questions
How can I tell if a solar panel is shaded or broken?
By the shape of a single clear day, and by comparing the panel with its neighbors on the same roof face. Shade takes a panel's output to near zero for part of the day and then lets it go — the drop has edges, and it happens at the same time tomorrow, because it is the sun moving past a fixed object. A failing panel is different: usually dead all day, or cutting in and out at random, while the panels beside it behave normally. A panel that keeps its normal shape and simply sits lower all day is more likely dirty than broken.
How can I tell shade from a cloud?
Compare the panel with its neighbors at the moment it dips. A cloud dims the whole system at once, every panel on every roof face, and they come back together. Shade dims only the panels something is blocking, while the others carry on. A whole roof face can be shaded too, by a building or a large tree; if every panel on one face starts late or stops early at the same time day after day while the other faces do not, that is shade, not cloud.
What does shade on one panel cost per year?
A residential panel on the systems we monitor is expected to produce roughly 600 to 700 kWh a year. A panel losing half its output to shade loses about 320 kWh a year. What that is worth depends on whether you would have used that power or exported it: at a retail rate near $0.30 a kWh it is about $95 a year, and at a NEM 3.0 export credit nearer $0.05 it is about $16.
What does shade on ten panels cost?
Ten panels each losing half is roughly 3,200 kWh a year — about $950 a year at a $0.30 retail rate, or about $160 if all of it would have been exported. Shade usually falls in the early morning and late afternoon, which for many households is when someone is home using power, so the retail end of that range is often the closer one.
Does shade on one panel drag down the whole string?
Not on a microinverter system, which is what SunPower and Enphase installations use. Each panel has its own inverter, so a shaded panel loses its own output and nothing else. Older string-inverter systems without optimizers are the ones where a single shaded panel can pull down its whole string.
Can shade be fixed?
Sometimes. A branch can be trimmed, a dish or an aerial can be moved, and soiling under a shadow can be washed. A chimney, a dormer, a roofline, or a neighbor's protected tree usually cannot — and knowing which one you have is worth more than guessing, because it tells you whether to spend money on it or stop thinking about it.
See your own panels, live.
See plans Try the demo Back to home